
![]()
![]()
July 2025 has gotten off to a slow start at Walt Disney World. For the third year in a row, July 4th holiday weekend crowd levels were “surprisingly” low, and wait times haven’t picked up much since. This shares data for the slowest days & weeks of the entire year, and discusses reasons for shorter lines during what used to be a peak period.
There have been headlines suggesting this is a “surprise” or “shocking,” but it really shouldn’t be. No weeks in the first half of July 2025 are on our Best & Worst Weeks at Walt Disney World in 2025-2026. In our Guide to Independence Day 2025 at Walt Disney World, we similarly began by indicating that the holiday weekend is no longer truly busy.
To the contrary, we stated that it was a “near-certainty” that the holiday weekend would not be bad. That it simply would not compare to 2019 or earlier, back when the parks were truly busy. We nevertheless expected higher crowd levels than the last two years by virtue of the July 4th falling on a Friday and Walt Disney World offering enticing discounts as opposed to overly aggressive blockouts. Instead, the holiday and beyond have been even slower than expected…
Suffice to say, the slower start to the first half of July 2025 was foreseeable, but not to this extent. Last month, we covered some of the reasons for this dynamic in Why Summer is the New Low Crowds Season at Disney World. I’m not going to rehash all of that, but those same reasons apply equally to Independence Day. Here’s a list of quick hits for those who want the rundown:
- Epic Universe (negligible impact)
- International Travel Pullback (1% to 1.5% impact)
- Economic Uncertainty (no impact)
- Starlight Delays (no impact)
- Shifting Schedules (major impact)
- High Heat & Humidity (moderate to major impact)
- Shorter Park Hours (some impact)
- No Special Events (some impact)
- Minimal Mitigation (some impact)
What this post is going to address is just how low wait times have been in the first half of July 2025. Then we’re going to offer a few more explanations as to why this month–especially Independence Day–has gotten slower at Disney.

As before, any theory that can be contradicted by higher crowds in the last few months or the next few months is off the table. Meaning that higher prices, fewer perks, and the company’s reputation do not explain the lower summer crowds trend. Figured this was worth a reminder as Walt Disney World just released October through December discounts.
Not only are the new discounts generally worse than last year, but availability is even more limited. Occupancy doesn’t equal attendance, but it’s sure looking like it’s going to be a strong holiday season. This isn’t to say Walt Disney World doesn’t have a pricing problem. It does as we’ve discussed in countless posts, including Is Walt Disney World Too Expensive for Middle Class Americans? But pricing does not explain why summer, in particular, continues to see its year-over-year wait times decrease.
Anyway, let’s turn to the month-to-date wait times data for July 2025, courtesy of thrill-data (ditto the above stats)…

July 2025 Wait Times
July has been the slowest month of the year to date, with an average wait time of 27 minutes and 1/10 crowd level. Prior to this month, the slowest month of the year was last month, when June had an average wait time of 31 minutes and a crowd level of 3/10. In the last 12 months, the only slower months have been last September and October, which were dragged down by hurricane scares.
The first week of July has been the slowest of the year-to-date, with a 26 minute average and crowd level of 1/10. This just barely edged out mid-June (27 minutes, 1/10). The last week of June is still the busiest of summer, and is unlikely to be surpassed in the second half of July and August 2025, based on both current trends and past precedent. These are about as close to patterns as we get for summer travel, and you can probably expect something similar in Summer 2026.
As always, that is an average, which still means that hour-plus waits (or even 90+ minutes!) are possible for the headliners at peak times. They’re just offset by 5-10 minute waits for lower profile attractions. There have also been plenty of days that have been busier than that average.

At the “higher” end of the spectrum, July 8-10 had 30-32 minute waits for 3/10 to 4/10 crowd levels. By contrast, July 2-6 has been the slowest stretch of the month-to-date, with wait times bottoming out at 21 minutes (1/10 crowds) and never exceeding 26 minutes (on average) for that stretch. Sunday, July 6 has been the slowest day of the entire year thus far. (If history is any indication, it’ll be surpassed in mid-August.)
Not all parks were equally uncrowded over Independence Day. As is always the case, Magic Kingdom and EPCOT overperformed. These two parks being busiest is particularly unsurprising since they’re the only two with special Fourth of July fireworks shows.
If anything, wait times data from these two parks doesn’t tell the full story of ‘feels like’ crowds because people are staking out prime spots for fireworks and just generally enjoying the patriotic atmosphere. This is a story that’ll repeat itself over the coming months at Magic Kingdom in the evenings once Starlight debuts–massive congestion along the parade route, but walk-on rides.
Animal Kingdom and Hollywood Studios were slow by any subjective or objective measure. Animal Kingdom had its lowest average wait time–23 minutes–of the year on July 4, 2025. Hollywood Studios had an average wait time of 22 minutes on both July 3 and July 6, which is extremely low for DHS. It’s usually the park with the highest average wait times at Walt Disney World!

Not that it’s any surprise at this point, but weekends are less busy than weekdays. This is a trend that’s several years running, but is amplified during summer and minimized once Party Season starts. If we’re looking at trend-lines, the drop from June to July 2025 has been the biggest of the entire year so far. June slightly less busy than May, which was slightly less busy than April (one minute month-to-month decreases in both cases).
The drop-off from June to July currently stands at 4 minutes. That’s pretty significant, but it probably won’t last. Digging deeper into the data, last July started similarly slow–especially as contrasted with June. However, wait times increased in the final two weeks of the month, with the last week and into early August seeing a slight spike.
Last year, July was 2 minutes slower than June and August was 2 minutes slower than July. That’s typical seasonality, and we should anticipate a repeat of that. What we should not expect is October to be the slowest month of the year again–that was depressed due to the aforementioned hurricanes.
With wait times data out of the way, let’s talk possible theories as to why July 2025 hasn’t been busy at Walt Disney World…

Residual DAS Impact
Disney overhauled Disability Access Service (DAS) at Walt Disney World last year, with changes taking effect on May 20, 2024. According to the company, the changes were due in large part to abuse, misuse, and proliferation of the program’s use–with issuances of DAS tripling from 2019 to last year. (See Disability Access Service (DAS) Changes at Walt Disney World FAQ.)
We’ve written a lot about the impact of the DAS changes on wait times at Walt Disney World. Most recently just last month in Is Lightning Lane Multi Pass Still “Worth It” at Disney World? One of our main points with this has been that standby lines are shorter and faster moving, with wait times being lower year-over-year as a direct result of the DAS crackdown. Even if attendance is exactly the same, crowd levels (as reflected in wait times) would be lower than the same dates last year as a result.
Given that, I’m not really sure how I missed this as a potential explanation last time. Probably because it’s been almost 14 months since the changes?! Regardless, the lengthy DAS eligibility period means year-over-year crowd comparisons are still showing residual effects of the DAS changes in June and July; it won’t be until August that the DAS changes are fully ‘worked through’ the system and not skewing YoY stats. This is still a big one, albeit not to the same extent as it was in May or earlier.
![]()
![]()
Changing Travel Preferences
The economy is something that inevitably comes up in the comments to posts like this, and we previously pointed out how Disney’s CFO said they need to be “smart about pricing,” especially at the lower end of the market where consumers are “feeling stress.” As a result, the company has held pricing steady and even offered more discounts, while concentrating price increases among premium packages or during high-demand dates.
Beyond that, it’s been the case for a while that not every American is experiencing the same economy. There are conflicting statistics that have befuddled economists when it comes to robust consumer spending, which they’ve just sort of hand waved away as YOLO spending, or attributed to consumers saying one thing but behaving differently.
None of that really matters here, as there’s key data that tells a fairly conclusive story. The TSA reported screening nearly 3.1 million travelers on Sunday, June 22, marking the single busiest day in the agency’s history. June 27 and June 29 now rank as the seventh and eighth busiest days respectively in TSA history, pushing 2025 to claim six of the agency’s top 10 busiest days on record. Volume didn’t slow down over Independence Day, as the TSA screened an estimated 18.5 million passengers over the holiday period.

The bottom line is that whatever issues might exist with the U.S. economy, the American consumer is still spending freely and going places for summer vacation. It’s certainly not impacting travel as a whole, although it could affect what consumers are doing once arriving at their destinations. (MCO’s volume actually is down year-over-year, but still well above 2019–but the airport added a new terminal, so it’s not exactly apples to apples.)
One way to reconcile all of this is changing travel preferences. This was touched upon in the comments to the previous post about the summer slowdown, but bears emphasizing here. It’s likely that Americans in higher income brackets are avoiding theme parks during the hotter months because they’re less enjoyable and there’s greater awareness of this.
In other words, even aggressive discounts are not enough to entice the upper middle class and above to visit Walt Disney World during the summer, because pricing isn’t what’s keeping them away in the first place. Not only this, but more mobility and alternatives have made cruises and international trips more popular among affluent Americans.
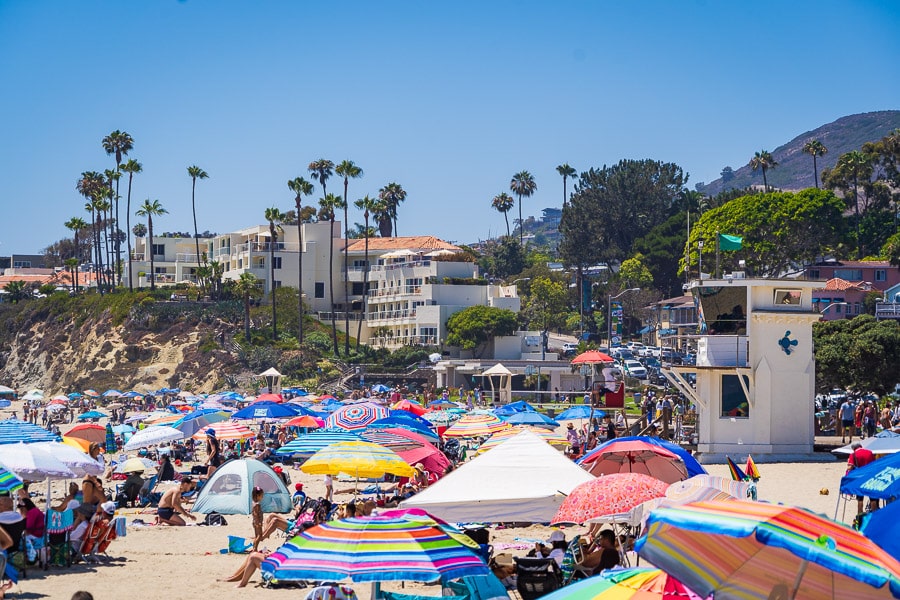
At the other end of the spectrum, there’s the great outdoors. We live relatively close to the beach, and our Independence Day weekend traditions are doing Disneyland and one of the beach cities. Traffic and congestion has gotten progressively worse in these locations, to the point that over-tourism is becoming an incredibly hot topic among locals. This July is busier than I’ve ever seen it at the beach, and I would’ve said the same thing about last year.
Although we don’t have firsthand experience with state and U.S. National Parks this summer, I’ve heard similar stories there among friends–with bigger crowds and more competition for park reservations (hardly unique to Walt Disney World–you need a reservation to see trees now, too!)
It’s unclear to me whether this is American consumers “trading down” for cheaper summer vacations, or simply a matter of people going where it’s cooler. We did Disneyland and the beach on back-to-back days, and the coast was about 10 degrees cooler than the parks–and Disneyland isn’t nearly as hot as Walt Disney World.
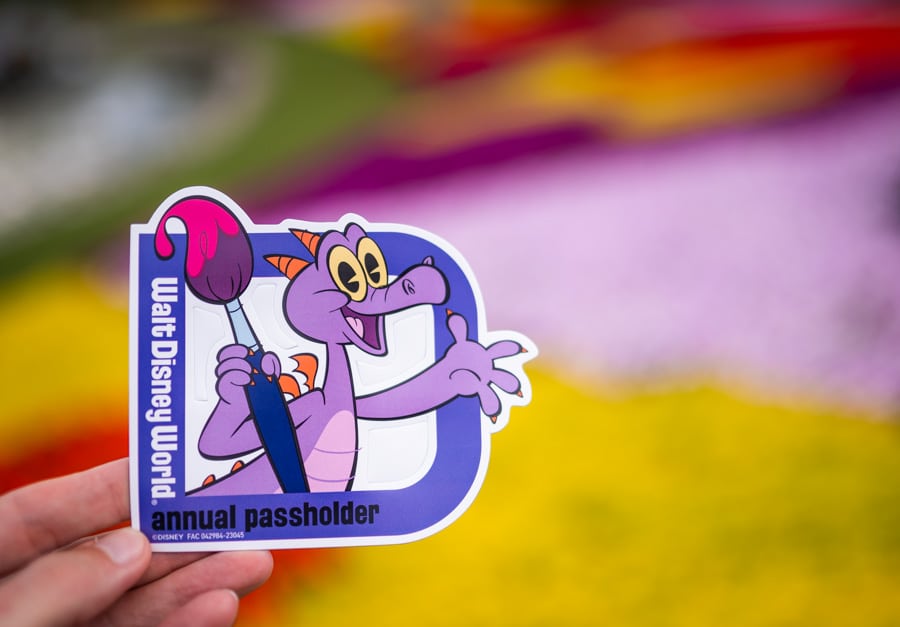
Annual Pass Blockouts
As you might recall, this trend really started in 2023 when early July was downright dead at Walt Disney World. It was such a hot topic that it drew an explanation from CEO Bob Iger, who attributed the slowness to an exhaustion of pent-up demand in Florida as a whole and unseasonably bad weather. He wasn’t wrong…but he also wasn’t completely correct.
The big “problem” was that Walt Disney World got overly-aggressive with ticket blockouts, with both most Annual Passholders and those who purchased discount Florida resident tickets and others prevented from visiting the parks over Independence Day. We know these are the primary reasons for the slowdown then, because the exhaustion of pent-up demand and hot summer weather were not just confined to those specific dates when crowd levels plummeted–they were across the board dynamics.
We’ve since drawn attention to Annual Pass blockouts as a predictor of crowds on multiple occasions. Basically, whenever both the Pixie Pass and the Pirate Pass–two affordable admission options for locals–are blocked out, you can expect local turnout to be depressed. And after the blockouts lift, there’s usually localized (get it?) pent-up demand. The big difference between summer and other times of year when this happens is that there are often enough out-of-state tourists to offset the blockouts during peak holiday weeks. Not so much in the summer.

Our strong suspicion is that there’s a disproportionate number of Pirate and Pixie Dust Annual Passes in circulation, in large part because they’re the cheapest options. At the very least, higher visitor-volume locals are more likely to have these APs, so they skew crowds more than the other passes. Walt Disney World doesn’t release statistical breakdowns of its AP population, so this is only theory.
However, it’s also corroborated by crowds. Whenever these passes are blocked out beyond their normal weekends, it shows up in wait times data. We’ve also seen this ahead of big spring break blockouts, as locals flood the parks before and after their blockout periods as opposed to the ‘peak’ week of spring break, which is blocked.
There are countless other examples like this, with a rush of locals “getting their Disney fix” before a blockout and then lower crowds during it. It also happens every year in January when the blockouts lift, and occurred last year for Labor Day. This explanation is well-supported by three years of data of Independence Day, which is why crowds were so much lower July 2-6, 2025. Even though TSA data shows that to be a peak travel time, it wasn’t enough to offset overly aggressive blockouts of locals.
![]()
![]()
Ultimately, my strong suspicion is that the last factor–Annual Passes–is the outcome determinative one when it comes to July 2-6, 2025 having unprecedentedly low crowd levels. That if you took the actual tourist attendance of Independence Day weekend and added the average Annual Passholder attendance for this summer, the number would come out looking fairly close to normal Summer 2025 days at Walt Disney World.
But again, “normal” by Summer 2025 standards is still a shadow of what things were like before 2016. Even after that, Independence Day continued to be very busy at Walt Disney World for at least a couple of years. It was not a peak season holiday like Easter, Thanksgiving, Christmas, New Year’s Eve, etc., but it also wasn’t moderate–like Memorial Day or Labor Day. It also doesn’t explain why other dates this month–such as July 12, 2025–have had ~26 minute average wait times and 1/10 crowd levels.
It’ll be interesting to see whether there’s a bounce-back in crowds towards the end of this month and in early August. Usually, there’s a second spike at the end of July, which we’ve attributed to ‘last hurrah’ summer travelers taking trips before school goes back into session. That’s likely to happen, but our expectation is still that July 2025 will be slower than June, and August 2025 will be slower than July. September and October are the big wildcards–the latter is almost certain to see a year-over-year bounceback, but September could once again reclaim the crown as the slowest month of the year.
Planning a Walt Disney World trip? Learn about hotels on our Walt Disney World Hotels Reviews page. For where to eat, read our Walt Disney World Restaurant Reviews. To save money on tickets or determine which type to buy, read our Tips for Saving Money on Walt Disney World Tickets post. Our What to Pack for Disney Trips post takes a unique look at clever items to take. For what to do and when to do it, our Walt Disney World Ride Guides will help. For comprehensive advice, the best place to start is our Walt Disney World Trip Planning Guide for everything you need to know!
Your Thoughts
Why do you think month-to-date July 2025 crowds at Walt Disney World have been below-average? Were you in the parks over Independence Day or in the week-plus since? What has been your experience with wait times and congestion? Any observations about attendance trends during the fall months that follow this summer dip? Hearing your feedback about your experiences is both interesting to us and helpful to other readers, so please share your thoughts or questions below in the comments!
